Markets & EconomyExplainer
Headline vs. core inflation: why September's CPI showed two numbers
U.S. inflation was 3.7% in September 2026, but core inflation was 2.6%. Learn what each number measures, why energy split them and which one to watch.

Quick answer
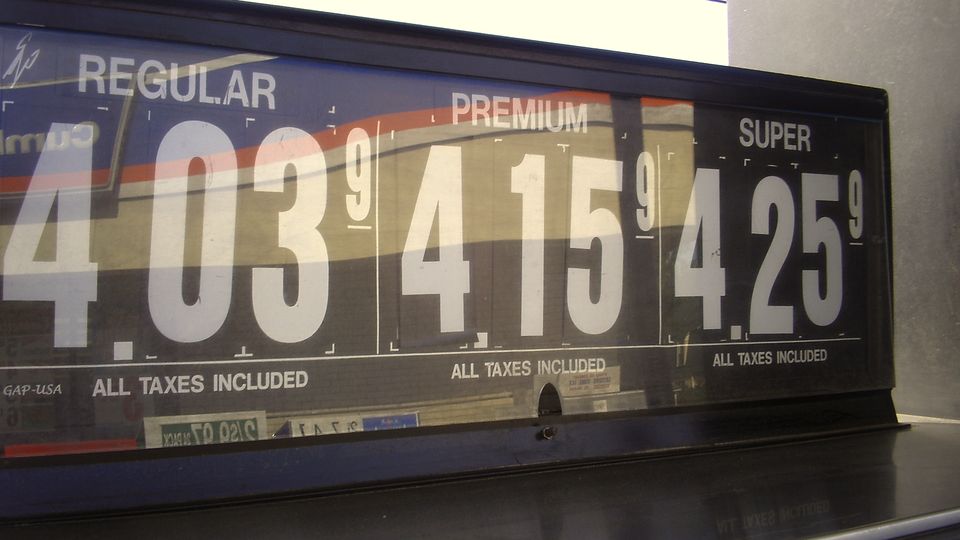
Headline inflation is the change in the price of everything in the CPI basket. Core inflation leaves out food and energy, whose prices jump around. In September 2026 headline CPI rose 3.7% over a year and core rose 2.6%; a 20.4% rise in energy prices explains most of the gap.
Key points
- Headline CPI covers the whole basket of consumer goods and services; core CPI is the 'all items less food and energy' index.
- BLS says some data users prefer the core index because food and energy prices are relatively volatile.
- In the 12 months to September 2026, headline CPI rose 3.7%, core rose 2.6% and energy rose 20.4% (BLS, released October 14, 2026).
- Energy is only about 6% of the CPI basket, but a 20% jump in it adds roughly 1.3 percentage points to headline inflation.
- Households pay headline prices; core helps show whether price increases are spreading beyond fuel and food.
What did the September 2026 CPI report show?#
The Bureau of Labor Statistics released the September 2026 Consumer Price Index on October 14, 2026. Over the 12 months to September, the all items index increased 3.7 percent before seasonal adjustment, while the all items less food and energy index rose 2.6 percent[1]. Those are the two numbers that headlines call "headline" and "core" inflation.
The split came from energy. BLS reported that the energy index increased 20.4 percent for the 12 months ending September, with gasoline up 34.2 percent, while the food index rose 2.5 percent over the year[1]. Within the month, the CPI rose 0.6 percent seasonally adjusted, but core rose 0.3 percent, as it did in August[1].
September 2026 CPI at a glance (12-month change)
What is the difference between headline and core inflation?#
The CPI is a measure of the average change over time in the prices paid by consumers for a representative basket of consumer goods and services[2]. Headline inflation is the percentage change in that whole basket. Core inflation uses one of the many other indexes BLS publishes: all items less food and energy[2].
Why leave out two things everyone buys? BLS explains that some users of CPI data use the core index because food and energy prices are relatively volatile, and they want to focus on what they perceive to be the core or underlying rate of inflation[2]. In other words, core is not a better measure of the cost of living. It is a tool for spotting the trend under short-term swings. For how the basket is built, see how CPI inflation is measured.
| Headline CPI | Core CPI | |
|---|---|---|
| Official BLS name | All items | All items less food and energy |
| What it covers | The full consumer basket | Everything except food and energy |
| Share of the basket (Dec 2025 weights) | 100% | About 80% |
| Best for | What prices you actually pay | Whether price rises are broad and lasting |
| 12-month change, Sept 2026 | 3.7% | 2.6% |
Weights: BLS relative importance, December 2025[3]. Changes: BLS September 2026 release[1].
How can a small slice of the basket move the headline so much?#
The CPI averages price changes using weights that represent each item's importance in consumer spending[4]. In December 2025 BLS put energy at 6.383% of the CPI-U basket, food at 13.698% and all items less food and energy at 79.919%[3]. A small weight times a very large price change still adds up.
Worked example
Worked example: rough contributions to September's 3.7%
Rough contribution = weight (share of the basket) × that group's 12-month change. This is a simplification: weights drift as relative prices change during the year, so the official BLS calculation differs slightly. The three pieces still add up to about 3.7%.
| Group | Weight (Dec 2025) | 12-month change (Sept 2026) | Rough contribution |
|---|---|---|---|
| All items less food and energy | 79.919% | 2.6% | 2.08 points |
| Energy | 6.383% | 20.4% | 1.30 points |
| Food | 13.698% | 2.5% | 0.34 points |
| Total | 100% | 3.7% published | 3.72 points |
Figures computed in code from the stated inputs; rounded to the nearest cent or tenth.
12-month price changes, September 2026
For a household, the same weights give a feel for the bill. If you spent $4,000 a month in the same proportions as the CPI basket, about $255 would go on energy; a 20.4% rise on that slice is about $52 a month. Your own share could be much higher or lower, depending on how much you drive and how you heat your home.
How have headline and core moved over the past year?#
The gap between the two measures has opened and closed with energy prices. The table shows 12-month changes computed from BLS index values[5]. BLS has no October 2025 index because data were unavailable due to the 2025 lapse in appropriations[5], so that month is missing.
| Month | Headline | Core | Energy |
|---|---|---|---|
| Nov 2025 | 2.7% | 2.6% | 4.2% |
| Dec 2025 | 2.7% | 2.6% | 2.3% |
| Jan 2026 | 2.4% | 2.5% | −0.1% |
| Feb 2026 | 2.4% | 2.5% | 0.5% |
| Mar 2026 | 3.3% | 2.6% | 12.5% |
| Apr 2026 | 3.8% | 2.8% | 17.9% |
| May 2026 | 4.2% | 2.9% | 23.5% |
| Jun 2026 | 3.5% | 2.6% | 15.7% |
| Jul 2026 | 3.4% | 2.5% | 14.7% |
| Aug 2026 | 3.4% | 2.4% | 16.3% |
| Sep 2026 | 3.7% | 2.6% | 20.4% |
Computed from BLS CPI-U index values, not seasonally adjusted[5]; September matches the published release[1].
Core stayed between 2.4% and 2.9% throughout, while headline swung from 2.4% to 4.2% as energy went from slightly negative to more than 20%. That is the pattern the core measure is designed to reveal: much of the gap between headline and core came from one volatile group rather than from prices across the basket.
Which inflation number does the Federal Reserve watch?#
Neither CPI measure is the Fed's official target. The Fed says inflation of 2 percent over the longer run, as measured by the annual change in the price index for personal consumption expenditures, is most consistent with its mandate[6]. The PCE price index, published by the Bureau of Economic Analysis, measures the prices that people living in the United States, or those buying on their behalf, pay for goods and services[7]; it rose 3.4% in the year to August 2026[7].
At its September 16, 2026 meeting the FOMC raised its target range to 3-3/4 to 4 percent and said inflation remains elevated[8]. To see how those decisions are made, read how the Federal Reserve sets interest rates.
How should you use the two numbers?#
Use headline for your own budget
Your rent, groceries and fuel are all in the headline number. When you check whether savings or a raise kept up, compare with headline inflation.
Use core to judge the trend
If core is steady while headline jumps, the rise is concentrated in food or energy; if core climbs too, price increases are spreading.
Check the energy line
When the two diverge, look at the energy index in the BLS release before drawing conclusions.
Note the next release date
BLS publishes the CPI on a fixed schedule; the October 2026 report is due November 10, 2026.
To see what inflation does to savings over time, read how inflation affects your money and try the inflation-adjusted return calculator. For one asset that some people claim protects against inflation, see is bitcoin an inflation hedge?.
What mistakes do beginners make?#
Thinking core is the 'real' inflation rate
Core leaves out costs every household pays. It is a guide to the trend, not a measure of your cost of living.
Comparing a monthly number with a yearly one
September's CPI rose 0.6% in the month and 3.7% over the year. Check which period a headline quotes before comparing it with another number.
Assuming energy swings always fade
Leaving energy out makes core steadier, but energy prices still hit household budgets in full, and the next months can differ. Watch whether core starts to climb too.
Mixing up CPI and PCE
The Fed's 2% goal is defined using the PCE price index, not the CPI. The two measures can differ.
What else do beginners ask?#
What was core inflation in September 2026?
The all items less food and energy index rose 2.6 percent over the 12 months to September 2026, and 0.3 percent in the month[1].
Why does core inflation exclude food and energy?
BLS says some data users prefer it because food and energy prices are relatively volatile and they want to focus on the underlying rate of inflation[2].
Is headline or core inflation more important?
It depends on the question. Headline shows the change in prices households actually pay; core helps show whether increases are spreading through the economy. The Fed's 2% goal uses the PCE index[6].
When is the next CPI report?
BLS scheduled the October 2026 CPI release for Tuesday, November 10, 2026[1].
What is the bottom line?#
Headline and core inflation answer different questions. Headline tells you how much more the whole basket costs; core strips out food and energy to show the underlying trend. In September 2026 a 20.4% jump in energy prices pushed headline CPI to 3.7% while core stayed at 2.6%. Read both, check the energy line when they diverge, and use headline when you judge your own budget and savings.
Sources
Numbers in brackets in the text point here. Grade A = primary source (regulator, statistics agency, law or official document).
- 1
- 2
- 3
- 4
- 5
- 6
- 7
- 8