News analysis ·
US PCE Inflation at 3.6% in September: Reading the Data
BEA says the PCE price index rose 3.6% from a year earlier in September, core 3.1%. How the gauge is built and why real spending barely grew.
The US Bureau of Economic Analysis (BEA) reported that its PCE price index was 3.6 percent higher in September than a year earlier, with the core measure up 3.1 percent. Consumer spending looked strong in dollars but almost flat once prices are removed. This article looks at how the gauge is built, why the gap between dollars and volumes matters, and how to read it over a horizon of years.
What BEA released for September
BEA's personal income and outlays report for September 2026 carries a release date of 2026-10-29. It covers what Americans earned, what they spent and what prices did over the month.
On prices, the PCE price index rose 0.5 percent from August. Excluding food and energy, it rose 0.3 percent. Measured against September a year earlier, the full index was up 3.6 percent and the core version was up 3.1 percent.
On income, BEA estimated that personal income grew $54.5 billion, or 0.2 percent. Disposable personal income, which is income after personal current taxes, grew $52.7 billion, also 0.2 percent. BEA said the gain came mainly from higher compensation and larger government social benefits.
How it is measured: dollars, volumes and two price lines
PCE stands for personal consumption expenditures. It is BEA's broad tally of what households buy, from groceries to medical care. The same data produce a price index, which tracks how much the cost of that whole basket changes.
Two versions are published. The headline index includes everything. The core index leaves out food and energy, whose prices tend to swing sharply from month to month. Core is not a better measure of the cost of living. It is a way to see the slower trend underneath the noise.
- Current-dollar PCE: spending measured in the prices of the day. It rose $113.1 billion, or 0.5 percent, in September, with $35.1 billion on goods and $78.1 billion on services.
- Real PCE: the same spending with price changes stripped out. It rose only $2.6 billion, which BEA put at less than 0.1 percent.
- Personal outlays: PCE plus personal interest payments and current transfers. They rose $113.0 billion.
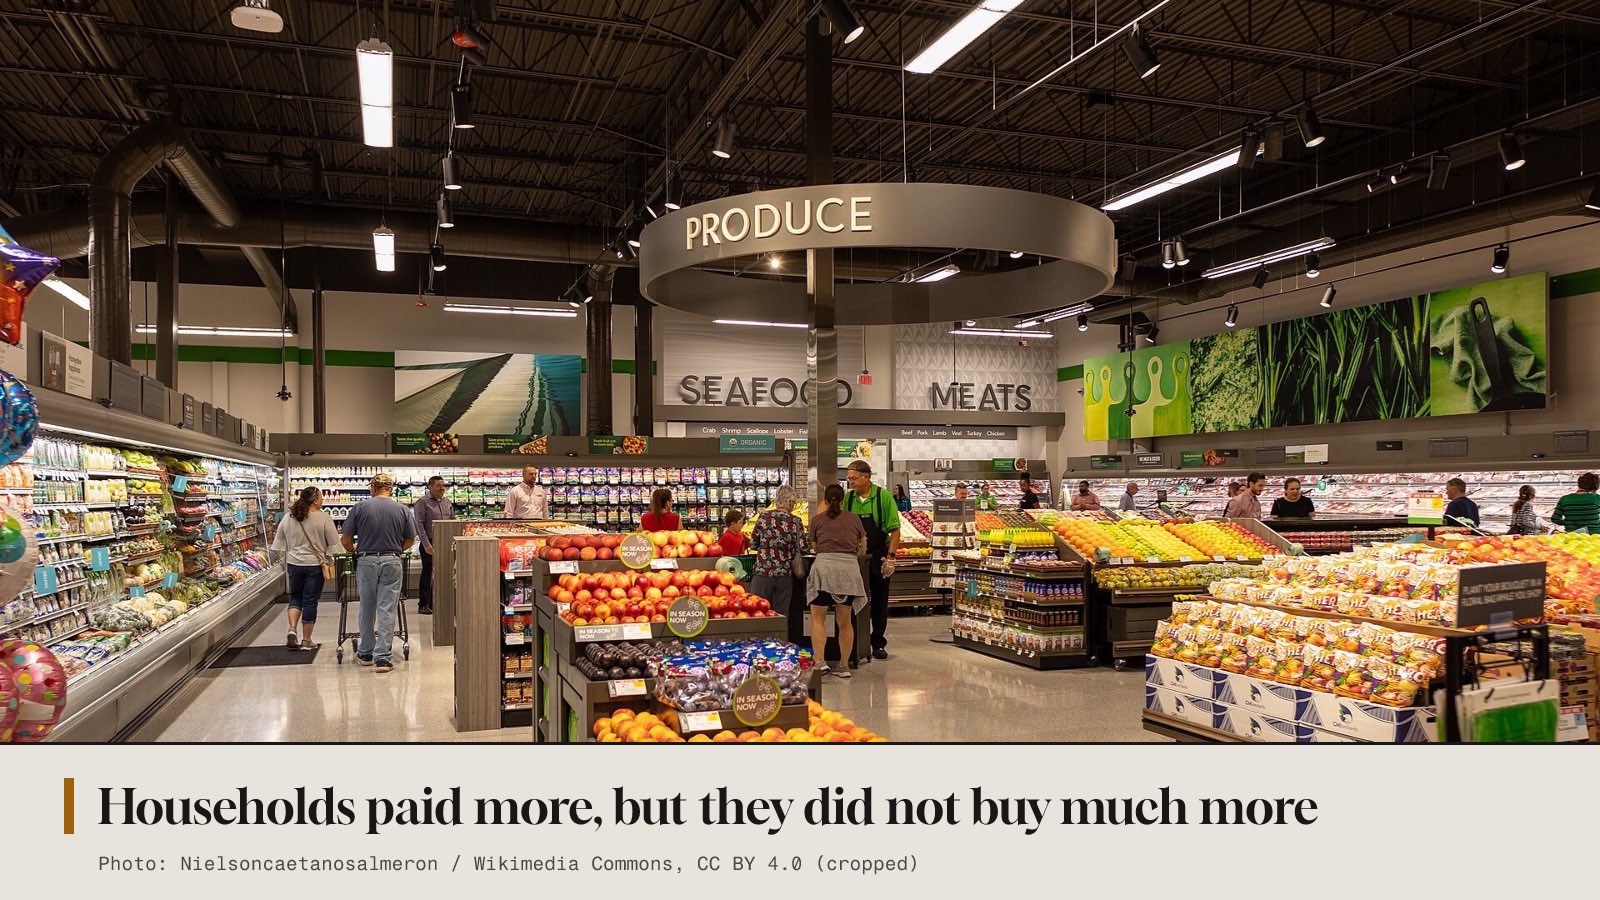
Put side by side, these lines tell one story. Spending in dollars grew at the same 0.5 percent pace as the price index in the same month. That is why the real figure barely moved. Households paid more, but in BEA's estimate they did not buy much more.
Reading headline against core
In September the headline monthly gain of 0.5 percent was larger than the core gain of 0.3 percent. When headline runs above core, it means food and energy prices were adding pressure beyond the broader trend. Over twelve months the same pattern holds, with 3.6 percent for headline and 3.1 percent for core.
For a long-term investor, neither number should be read alone. Headline is what households actually face. Core is a guide to whether price pressure is spreading through the economy or sitting in a few volatile categories. When core is also running well above year-earlier prices, as it is in this release at 3.1 percent, price pressure is not confined to food and energy alone.
Why it matters over years, not days
Inflation quietly sets the bar every investment must clear. A portfolio that grows in dollars but not faster than prices has not grown in what it can buy. The gap between current-dollar and real PCE in this report is a clear picture of that idea at the level of the whole economy.
The saving figures add context. BEA put personal saving at $911.1 billion and the saving rate, saving as a share of disposable income, at 3.8 percent. A low saving rate means current spending leans more on income as it arrives. That can matter for how resilient consumer demand is if income growth slows, which is a question about the economy, not a forecast.
Finally, these are estimates, and they change. BEA revised its July and August figures using updated BLS CES payroll data, and it revised personal interest income using new data from the Bureau of the Fiscal Service. BEA also notes that the next report will supersede these numbers. A single month is a draft, not a final record. That is one reason to watch the twelve-month figures and the trend across several releases rather than react to one print.
What to watch next
BEA has set November 25, 2026 as the date for the October 2026 report. That release will show whether the monthly price gains continued and whether real spending picked up or stayed flat. It will also bring any further revisions to September.
Questions to ask about your own plan
These questions are meant to help you think, not to point you toward any action.
- Do I judge my long-term returns after inflation, or only in dollars?
- Which inflation measure, headline or core, is closer to the costs I will face in the years ahead?
- Would a run of revised or surprising monthly data change my plan, and should it?
Sources
- BEA, 29 Oct 2026
AI-drafted from the official releases cited above and published automatically after checks that every number matches its source and no sentence is copied. No human edited it. It explains what the data means for long-term investors, not what to trade.