News analysis ·
US housing starts fall 5.2%: reading the Fed's dilemma
September housing starts, permits and pending sales all missed forecasts. How each series is measured, and why it matters to the Fed's next rate moves.
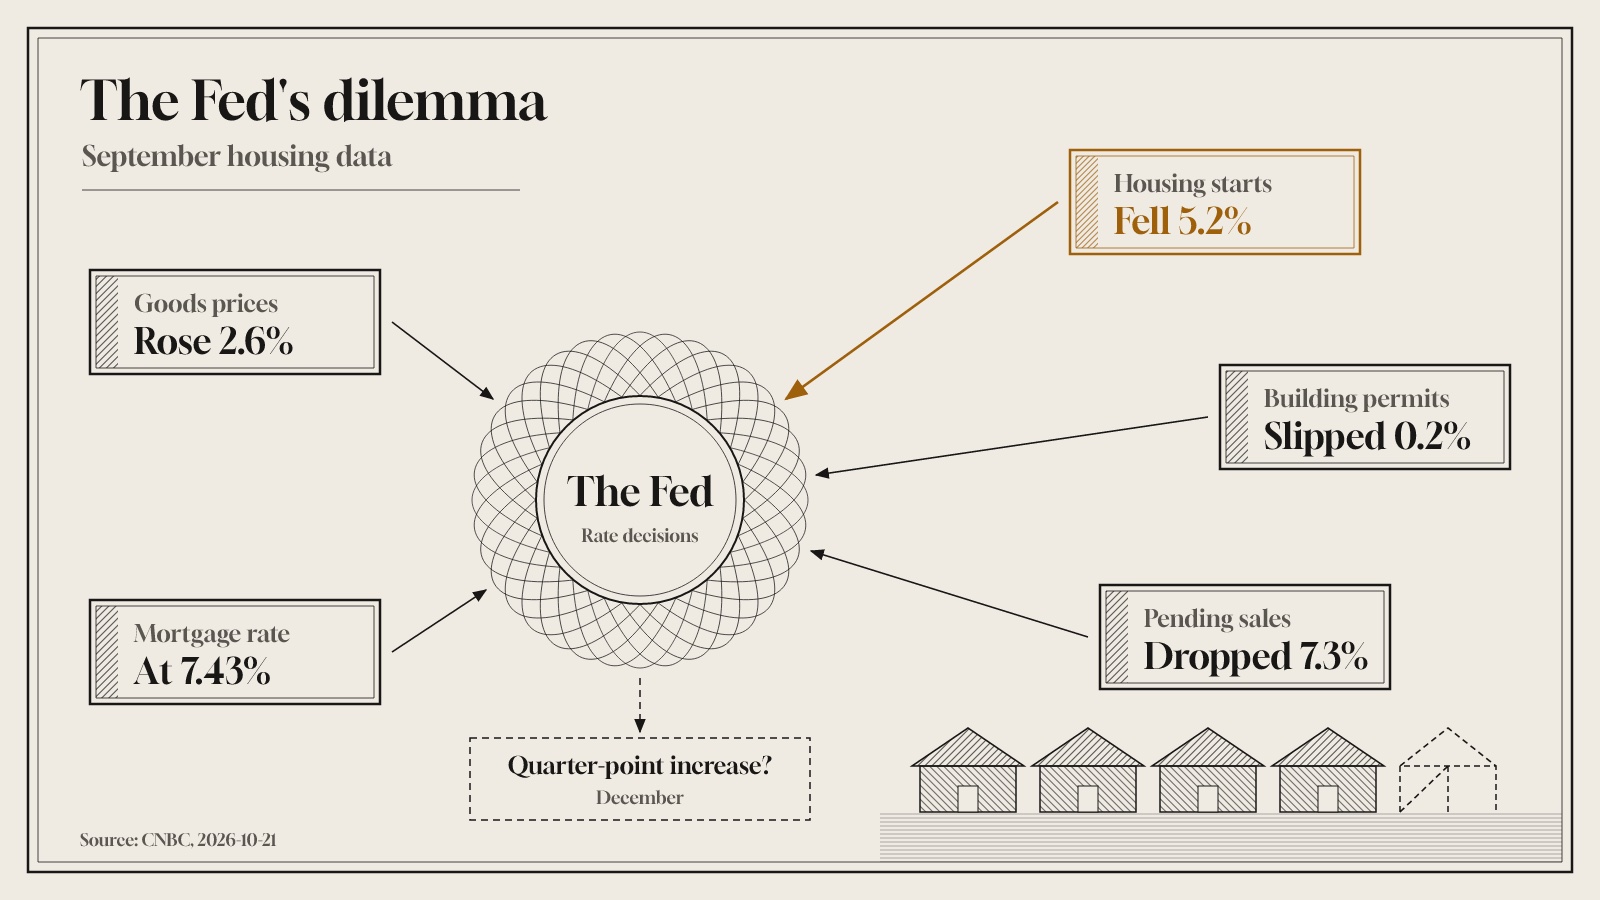
US housing data for September came in well below forecasts, CNBC reported, with housing starts down 5.2% and pending home sales at a record low. The weakness lands while the Federal Reserve is still fighting inflation and markets price further rate increases. This article looks at what each housing number counts and why a long-term investor might watch it.
The September releases
According to Commerce Department figures cited by CNBC, privately owned housing starts fell 5.2% in September. Forecasters had expected a decline of 0.4%. Building permits slipped 0.2%, while the Dow Jones consensus had looked for a 2% gain. Single-family permits came to 845,000, which is 4% below August and the weakest reading since 2023.
A separate report from the National Association of Realtors showed its pending home sales index at a record low, in data going back to 2001. The index fell 7.3% from the prior month and 11.3% from a year earlier. Wall Street had expected a dip of only 0.4%.
NAR chief economist Lawrence Yun tied the weakness to quickly rising mortgage rates. Mortgage News Daily data showed the 30-year rate above 7% for most of September, ending near 7.6%. CNBC put the current rate at 7.43%, and noted that home builder sentiment is at its lowest in 14 years.
How these numbers are measured
The three series answer different questions, and reading them together is more useful than reading any one alone.
- Housing starts count new homes where construction has actually begun in the month. They are a direct read on building activity.
- Building permits count approvals to build. A permit usually comes before a start, so permits act as an early signal of future construction.
- Pending home sales track contracts signed on existing homes that have not yet closed. Because a contract comes before the sale is recorded, this index points to where completed sales may head next.
Each number is also compared with a forecast. A result far below expectations, as in September, tells you the slowdown was sharper than economists had built into their views. Monthly housing data are often revised, so a single month is a starting point, not a verdict.
Why the Fed cannot simply respond
In a softer economy, weak housing might push a central bank toward easier policy. Lower rates reduce borrowing costs and tend to support demand. The Fed's problem is that inflation has not cooled. Wholesale final demand goods prices rose 2.6%, the quickest pace in a Bureau of Labor Statistics series dating to December 2009.
Fed officials said they are watching inflation pressure from heavy investment in artificial intelligence, which is lifting the cost of chips and electronics. They also think that AI spending may offset weak sectors such as housing. Markets expect the Fed to leave its benchmark rate unchanged at next week's meeting, CNBC reported, but CME Group FedWatch futures pricing points to a likely quarter-point increase in December and another in March 2027.
Yun offered a different view on where borrowing costs go from here: "Given that mortgage rates have already risen much more than the Federal Reserve's short-term interest rate hikes, mortgage rates could be topping out." That is his assessment, not a forecast this site makes.
Why it matters over years, not days
Housing is one of the main channels through which rate decisions reach the real economy. When borrowing costs rise, fewer homes are bought and built.
There is also a structural point. More than 95% of mortgage holders pay less than the current rate, and 65% are 2 percentage points below it. This is the lock-in effect: owners hold on to cheap loans rather than move. It keeps turnover low for as long as the gap lasts, which can make housing a drag on activity for a long stretch rather than a short dip.
Goldman Sachs economist Ronnie Walker expects housing to weaken further before it stabilizes, with affordability the main drag in 2027. Goldman projects residential investment falling 2.5%, 4% and 1% over the next three quarters, and sees 3.9 million existing home sales in 2027, 26% under 2019 levels. Fwdbonds chief economist Chris Rupkey warned that housing faces a deep freeze unless Washington makes new homes more affordable. These are views from economists, and outcomes may differ.
For a long-term investor, the lesson is about how to read the data, not about acting on it. A single weak month says little. Weak starts, permits and pending sales alongside sticky inflation show the Fed balancing two pressures at once, which matters for bonds, borrowing costs and company earnings over several years.
Questions to ask about your own plan
None of these data points tell you what to buy or sell. They can help you check whether your plan still fits the kind of economy the data describe.
- Does my plan assume interest rates fall soon, and how would it hold up if they stay high for longer?
- How much of my portfolio depends on sectors that are sensitive to borrowing costs, such as housing and construction?
- Am I reacting to one monthly release, or to a trend that has held across several reports?
Sources
- CNBC, 21 Oct 2026
AI-drafted from the official releases cited above and published automatically after checks that every number matches its source and no sentence is copied. No human edited it. It explains what the data means for long-term investors, not what to trade.