News analysis ·
UK Inflation Hits 3.6% in October: Reading the Print
UK consumer inflation rose to 3.6% in October, led by motor fuel. How the rate is measured and why it matters for the Bank of England into 2027.
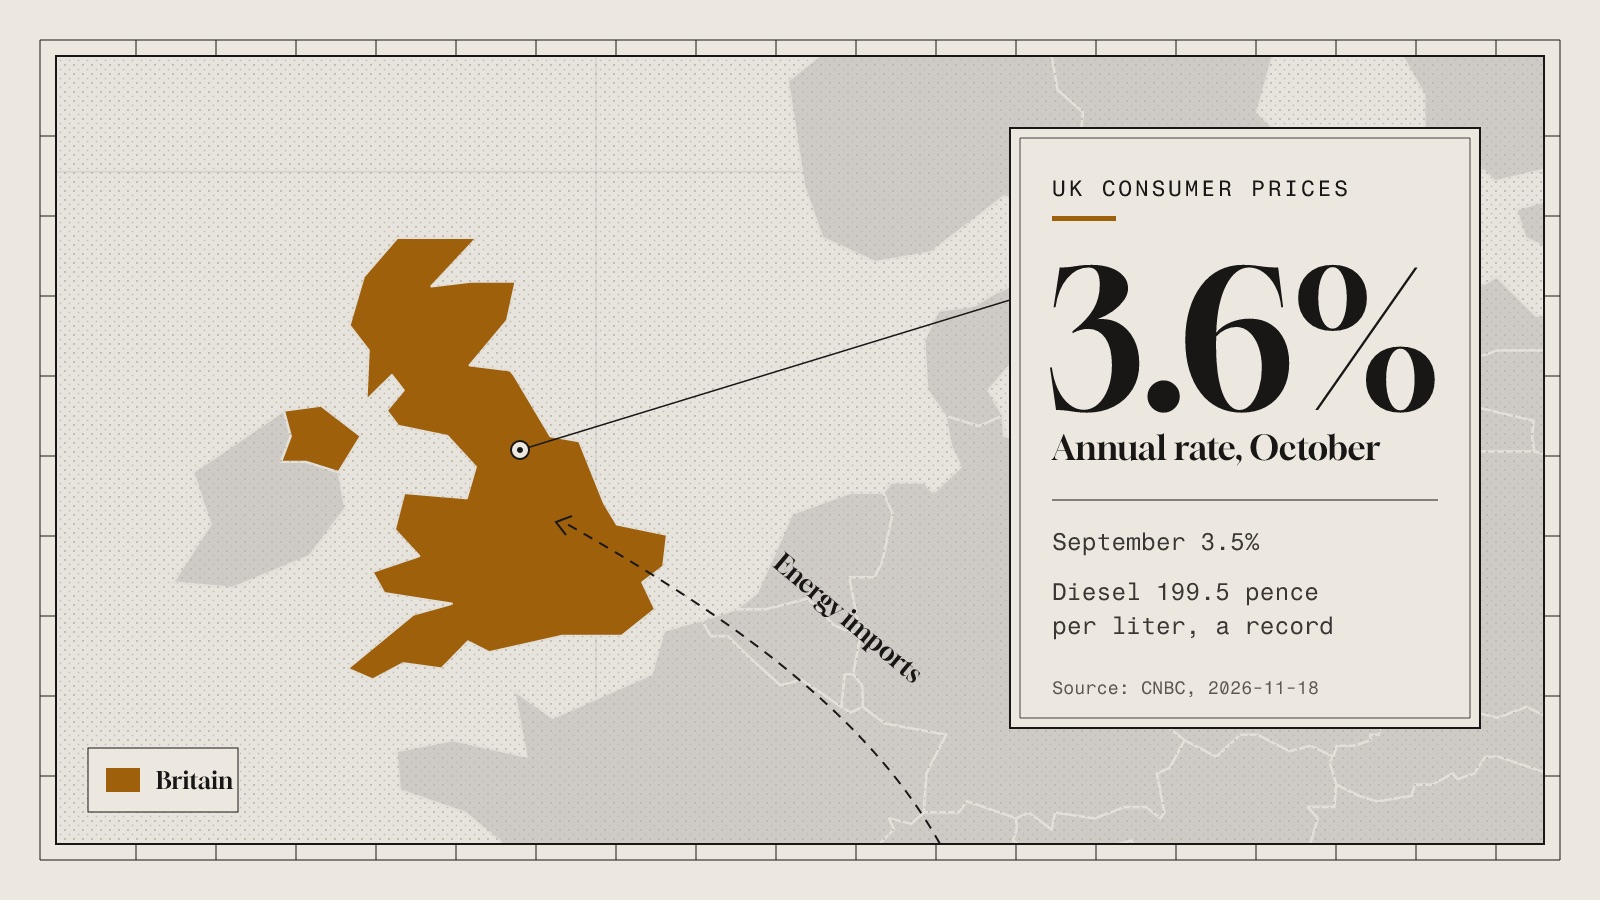
UK consumer prices were 3.6% higher in October than a year earlier, the highest annual rate in a year, CNBC reported on the Office for National Statistics release. The rise was driven mostly by motor fuel. This article looks at what the number counts, why one category can move the whole index, and what the reading means for the Bank of England's path into 2027.
The October release
The annual rate moved up from 3.5% in September to 3.6% in October. Economists surveyed by Reuters had expected exactly that figure, so the print was not a surprise to forecasters. What stands out is less the size of the step and more the direction: the rate has been climbing since late February, when fighting between the U.S. and Iran started, after a brief dip that an energy price cap helped produce. That cap was then raised in July.
According to the ONS, motor fuel was the largest single contributor to the higher rate. Fuel costs were up 33.2% from a year earlier, the steepest annual jump since July 2022, when energy prices surged after Russia's full-scale invasion of Ukraine. Diesel reached an average of 199.5 pence per liter in October, a record in a series the ONS started in 1996. Petrol averaged 174.7 pence a liter, a level last exceeded in Aug. 2022.
How it is measured
The headline figure is the Consumer Prices Index, or CPI. Statisticians price a fixed basket of goods and services each month and weight each item by how much households spend on it. The annual rate compares the basket's cost this month with the same month a year earlier.
Two details in this release show how the arithmetic works. First, an annual rate depends on the starting point as well as the latest month. The ONS noted that from September to October the average petrol price gained 5.2 pence (7 cents) a liter, against a rise of only 0.7 pence per liter over the same months a year before. When this year's monthly move is much bigger than last year's, the annual rate climbs. Second, a category with a large weight and a large price change can pull the whole index, even if most other prices are calm. That is why a headline print is best read next to its breakdown and next to core inflation, which strips out volatile items such as energy and food.
Why an energy importer feels this more
Britain imports more energy than it produces. That leaves its price level exposed to shocks far from home, such as the disruption of shipping through the Strait of Hormuz. CNBC noted that oil has fallen back from wartime peaks well above $100 a barrel but remains elevated.
For a long-term investor, this is the useful reading of the October number. It is less a story about the domestic economy running hot and more a story about imported costs feeding through. Imported energy inflation is hard for a central bank to control directly, yet it can still shape wage demands and price setting if it lasts. That second-round risk is what policymakers watch.
Why it matters over years, not days
The Bank of England raised its policy rate earlier in November for the first time in three years. It also warned that inflation might reach 5% by mid-2027. In the November Monetary Policy Report, Governor Andrew Bailey said energy and inflation risks tilt higher unless real progress is made toward ending the Middle East conflict. CNBC reported that markets price roughly an 80% chance of another hike when the Bank meets for the last time this year.
At JPMorgan Personal Investing, investment strategist Scott Gardner said a recent drop in oil after the U.S. midterm elections could ease coming readings. He still cautioned that "the broader outlook for UK inflation remains challenging as we approach 2027", and that the Bank will be watching for a rise that sticks.
Over a multi-year horizon, the level of interest rates and the persistence of inflation matter more than any single month. Higher policy rates change the return on cash, the pricing of bonds and the discount rate applied to future company earnings. Persistent inflation erodes the real value of fixed payments. A print in line with forecasts does not change those forces by itself, but a run of rising prints can shift the path a central bank chooses.
Questions to ask about your own plan
Rather than reacting to one release, it can help to check how your plan handles a period of stubborn inflation and higher rates.
- Do I measure my returns after inflation, or only in nominal terms?
- How much of my plan depends on fixed payments whose real value inflation can erode?
- Would my allocation still make sense if rates stayed higher for longer than I assumed?
None of these questions has a single right answer. They simply turn a headline into a check on assumptions. Remember that investments can fall in value and you can lose money, whatever inflation and interest rates do.
Sources
- CNBC, 18 Nov 2026
AI-drafted from the official releases cited above and published automatically after checks that every number matches its source and no sentence is copied. No human edited it. It explains what the data means for long-term investors, not what to trade.