News analysis ·
US jobless claims at 194,000: how to read the data
Initial jobless claims fell to 194,000 in the week ended Oct. 17. What the weekly count measures and why long-term investors watch it before the Fed meets.
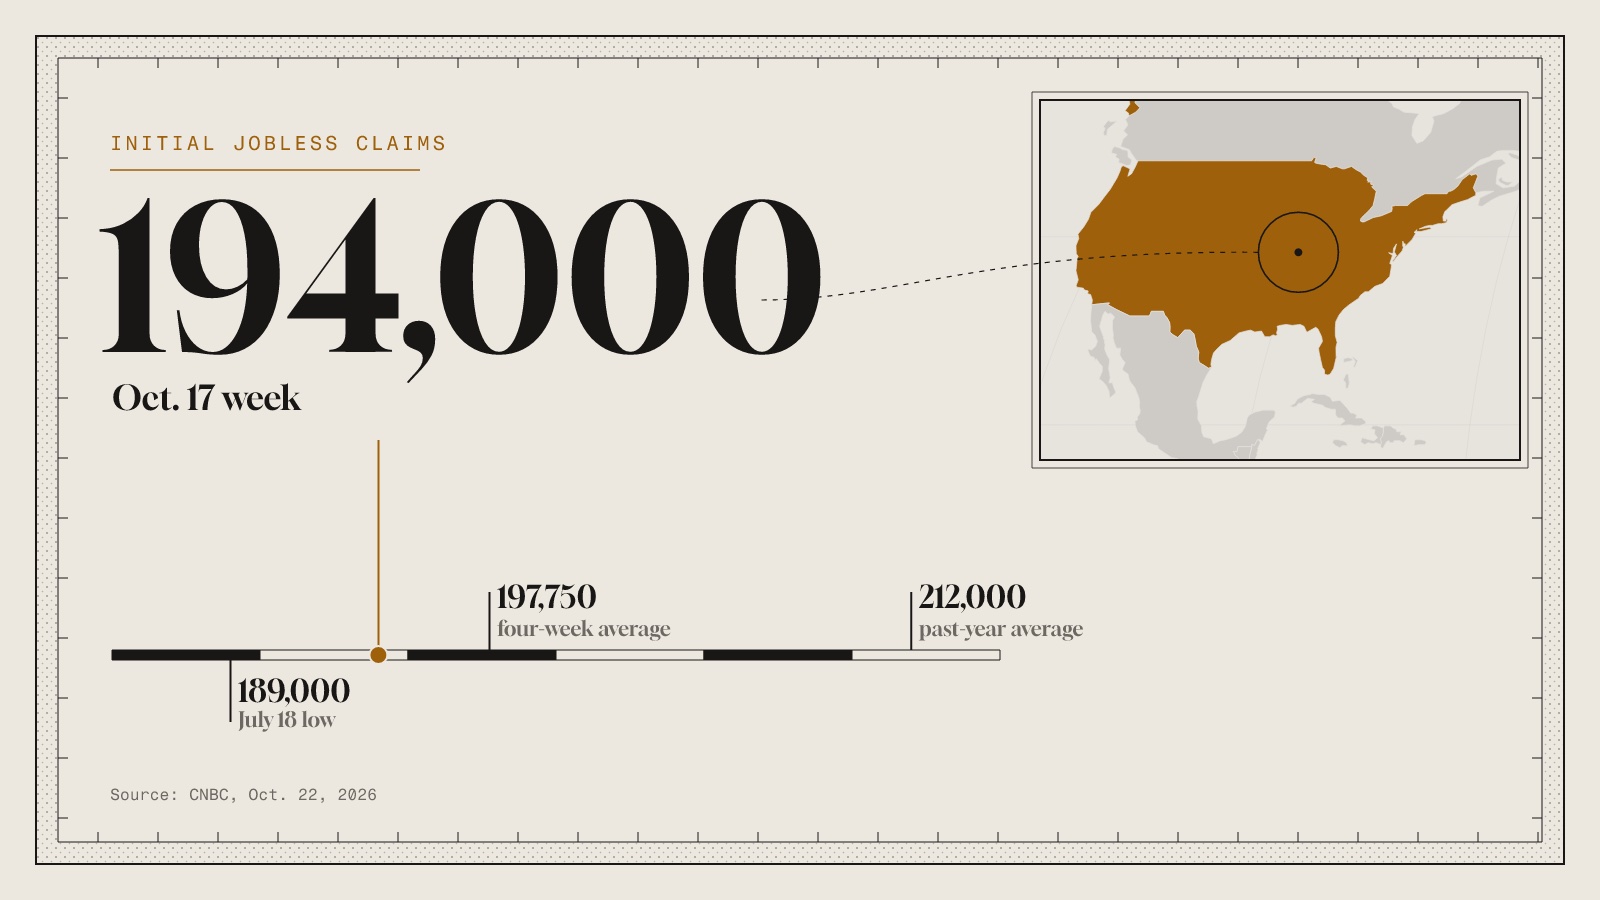
First-time claims for US unemployment benefits fell to a seasonally adjusted 194,000 in the week ended Oct. 17, according to Labor Department figures reported by CNBC on Thursday. That is close to the lowest level in a record that goes back almost six decades. This note looks at what the weekly count actually measures, how it fits with weaker hiring data, and why it matters to someone investing over years.
The release: claims sit near a historic low
The new reading is just above 189,000, the count for the week of July 18. That July figure was the smallest since September 1969. Over the past year, claims have averaged 212,000 a week, and the four-week moving average has eased to 197,750.
CNBC called the pattern a low-fire market. Employers are holding on to the staff they have, even though they are not adding many new people. In a client note, Jefferies' chief U.S. economist, Thomas Simons, wrote that "the claims data suggests that labor market conditions are stable". He made that point against a backdrop of gloomy confidence surveys and frequent headlines about job cuts.
How it is measured
An initial claim is a first application for unemployment insurance. It is a flow, not a stock: it counts people who newly ask for benefits in a given week, not everyone who is out of work. That makes it one of the quickest official signs of layoffs, because it arrives every week rather than every month.
The headline number is seasonally adjusted. Hiring and firing follow a calendar, with holidays, school terms and weather all shifting the raw count. The adjustment strips out those regular swings so that one week can be compared with another. It is an estimate, so a single week can still be noisy.
That noise is why many readers prefer the four-week moving average. It is simply the average of the latest weeks, which smooths out one-off jumps. Today the average, at 197,750, tells a similar story to the headline 194,000. When the single week and the smoothed line agree, the signal is easier to trust.
Low firing is not the same as strong hiring
Claims capture only one side of the job market: people losing work. They say little about how easy it is to find a new job. Other data cited by CNBC show that side looks softer.
Nonfarm payrolls, the monthly count of jobs added by employers, grew by only 29,000 in September. Monthly gains in 2026 have averaged 69,000. The unemployment rate rose to 4.2%, which CNBC attributed mostly to a sharp jump in labor force participation, meaning more people started looking for work. Bureau of Labor Statistics data published Sept. 29 showed layoffs fell by 61,000 in August. Measured over the year before, the layoff rate slipped to 1% of all workers, down 0.2 percentage point, while job openings were roughly flat.
Put together, the picture is a market where few people are being let go and few are being taken on. That kind of balance can hold for a while. It can also change if firms that have been reluctant to cut decide the outlook has turned. Claims are one of the first places such a shift would show up.
Why it matters over years, not days
The timing of this week is useful. It falls in the reference period the BLS uses to calculate payroll growth, and the October jobs report is due Nov. 6. So the low claims number is an early hint about the month that report will describe, not a forecast of it.
It also lands days before a Federal Reserve rate decision. Fed officials have lately described the labor market as a source of strength and turned more of their attention to inflation, which is running well above the 2% target. According to CNBC, markets expect no hike in October but price in another quarter percentage point increase in December. Market pricing is an expectation, not a promise, and it can change quickly.
For a long-term investor, the main lesson is about the policy mix. When layoffs stay low, the central bank has less reason to worry about jobs and more room to focus on prices. That can mean borrowing costs stay higher for longer, which affects bond yields, company financing and the value placed on future earnings. None of this tells anyone what to buy or sell. It explains why a dull weekly number can shape the backdrop for years of returns, and investments can lose value whatever the economy does.
Questions to ask about your own plan
A single weekly release should rarely change a long-term plan. It can still be a prompt to check that your plan does not depend on one view of the economy.
- Would my mix of stocks, bonds and cash still suit me if interest rates stayed higher for longer than I expect?
- Am I reacting to one week of data, or to a trend that shows up across several releases?
- If my own income depends on a job, how much of a cash buffer would I want if the low-fire pattern changed?
Sources
- CNBC, 22 Oct 2026
AI-drafted from the official releases cited above and published automatically after checks that every number matches its source and no sentence is copied. No human edited it. It explains what the data means for long-term investors, not what to trade.