News analysis ·
US Multinationals Made $5.7 Trillion: Reading BEA Data
BEA's 2024 data on US multinationals: value added, jobs, capital spending and R&D. How the figures are built and why the shares matter to long-term investors.
The U.S. Bureau of Economic Analysis (BEA) has published its yearly look at US multinational enterprises, and the 2024 figures show output growing far faster than jobs. US parent companies produced $5.7 trillion of value added, up 8.5 percent, while their workforce at home grew only 0.1 percent. This article looks at what the release counts, how to read its shares, and why a preliminary estimate deserves some caution.
What BEA released
According to BEA, the release covers US parent firms together with the foreign affiliates in which they hold a majority stake. The headline numbers describe a group of companies that is large, still growing, and leaning harder on investment than on hiring.
Worldwide value added by US multinationals, measured in current dollars, reached $7.4 trillion in 2024, an 8.0 percent increase. Worldwide headcount reached 44.2 million workers, compared with 43.8 million in 2023, a gain of 0.9 percent. Spending on property, plant and equipment climbed 7.1 percent to $1.2 trillion, and research and development (R&D) outlays grew 10.1 percent to $622.7 billion.
The growth in staff came mostly from abroad. Foreign affiliates employed 14.3 million people after a 2.7 percent rise, with India, Mexico and the United Kingdom hosting the most affiliate jobs. US parents had 29.9 million workers at home, and their slice of total multinational employment slipped to 67.6 percent from 68.1 percent.
How it is measured
Value added is the key term. It is what a company produces minus what it buys from other firms, so it strips out double counting. BEA treats parent value added as the parents' direct contribution to US gross domestic product (GDP). That makes it a better yardstick than sales, which can include the same inputs many times over.
The figures are in current dollars. That means they are not adjusted for inflation, so part of the 8.5 percent rise in parent value added can reflect higher prices rather than more output.
The 2024 numbers are preliminary, and the 2023 numbers have been revised. BEA updated 2023 with new source data; its first estimates for that year appeared in August 2025. BEA has also changed how it protects the identity of survey respondents. The new method, called coarsening, uses rounding, aggregation and ranges, which lets the agency publish more detail without exposing individual companies.
The shares tell the bigger story
Raw totals grow with the economy. Shares show whether these firms are gaining or losing weight inside it. Here the shares point in different directions, and that is the part only a close reading reveals.
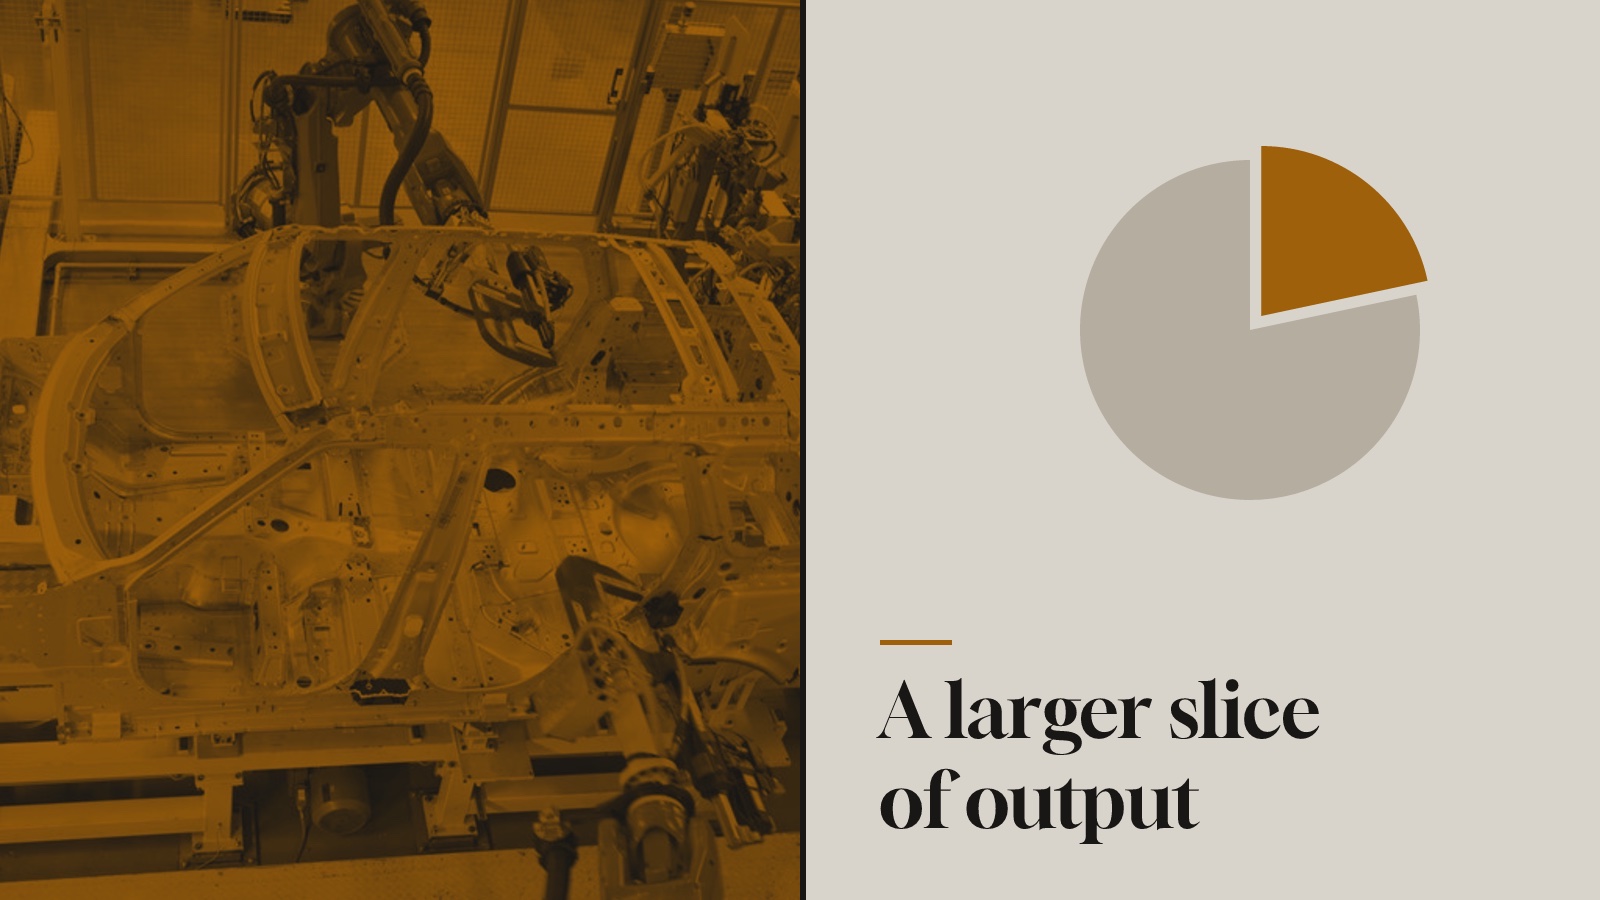
US parents generated 21.8 percent of private-industry value added in 2024, up from 21.2 percent. Yet they employed 21.7 percent of private-industry workers, down from 21.9 percent. Put simply, the same group produced a larger slice of output with a smaller slice of the workforce. For an investor, that is a sign of rising output per worker at the largest companies, whatever the cause.
Investment is even more concentrated. Parent capital spending of $968.7 billion equalled 36.5 percent of all US private-business capital expenditures. Parent R&D of $536.5 billion equalled 69.6 percent of all business research done inside the United States, a share BEA shows for the first time in this release. Foreign affiliates added $216.2 billion of capital spending and $86.2 billion of R&D.
Why it matters over years, not days
Capital spending and R&D are bets on future output. When most of a country's business research runs through one group of firms, the long-run productivity of the economy depends heavily on how those firms invest. A long-term investor who owns a broad stock index already owns many of these companies, so this release is a rare official view of what they do with their cash.
Concentration cuts both ways. It can mean scale and efficiency. It also means that a pullback by a relatively small set of firms could weigh on national investment figures. The release does not forecast either path, and these are annual figures that arrive with a long delay.
The revision cycle is a reminder to treat a single year with care. A preliminary figure is a first draft. Watching how numbers change between the first estimate and the revision is often more useful than reacting to the first print.
Questions to ask about your own plan
Official data like this does not tell anyone what to buy. It can help you check whether your plan rests on assumptions you understand.
- How much of my portfolio depends on the largest companies, and am I comfortable with that concentration?
- Do I judge economic news by revised data, or do I react to the first estimate?
- When I see a growth figure in current dollars, do I remember to ask how much of it is inflation?
Sources
- BEA, 20 Nov 2026
AI-drafted from the official releases cited above and published automatically after checks that every number matches its source and no sentence is copied. No human edited it. It explains what the data means for long-term investors, not what to trade.