News analysis ·
US Producer Prices Hit 6.5% a Year: Reading October PPI
October PPI rose 0.3%, below forecasts, yet the annual rate reached 6.5%. We explain what PPI measures and why the pipeline matters to investors.
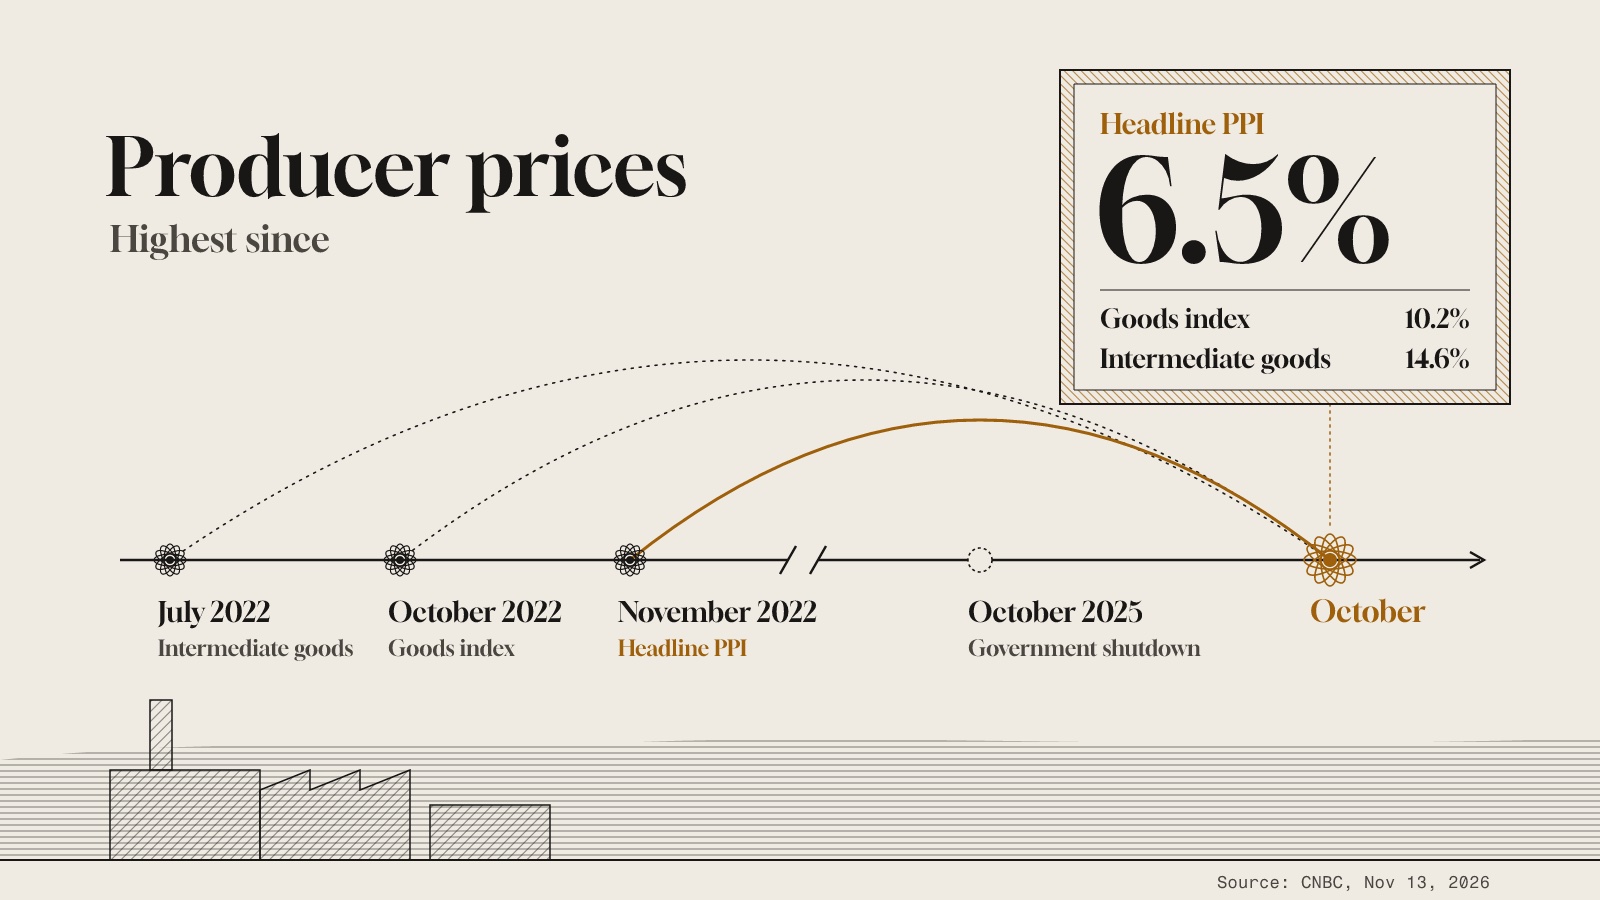
US producer prices rose a seasonally adjusted 0.3% in October, a little softer than the 0.4% economists polled by Dow Jones had expected, the Bureau of Labor Statistics reported on Friday. Over 12 months, though, the index was up 6.5%, its fastest yearly pace since November 2022, according to CNBC. This article looks at what the producer price index counts, where the pressure sits inside it, and why a long-term investor might watch the pipeline rather than the monthly surprise.
The release: a soft month inside a hot year
Two readings of the same report point in different directions. The monthly change came in below forecasts. The annual rate, by contrast, picked up by 0.2 percentage point to 6.5%.
Core PPI, which leaves out food and energy because they swing sharply, gained 0.3% and matched expectations. A narrower gauge that also strips out trade services rose faster, at 0.5%. Goods prices climbed 0.5% on the month, and the goods index stood 10.2% above its level a year earlier, the largest 12-month jump since October 2022.
Services were calmer. Final demand services rose 0.2%, and most of that came from transportation and warehousing, where truck freight transportation climbed 3.9%.
How it is measured
The producer price index tracks what domestic producers receive for their output before it reaches consumers. That is different from the consumer price index, which tracks what households pay at the till. PPI is closer to the factory gate and the loading dock.
The headline figure is built on final demand: goods and services sold to their last buyer. Alongside it, the BLS publishes intermediate stages, which cover inputs that businesses buy from each other and turn into something else. These earlier stages are sometimes read as a view of costs still working their way through the system.
Two technical points help. Seasonal adjustment removes regular calendar patterns, so a monthly change is easier to compare across the year. And a 12-month rate compares this October with last October, so it reflects a full year of changes, not just the latest month.
Where the pressure is building
The intermediate figures are the striking part of this report. Prices for intermediate processed goods were 14.6% above October 2025, the biggest annual increase since July 2022. Intermediate services prices rose 6.9%, the largest gain since November 2022.
Consumer data from earlier in the week pointed the same way. October CPI rose 0.4% and core CPI 0.3%, each 0.1 percentage point above forecasts. Because the October 2025 government shutdown left gaps in data collection, the BLS did not publish a 12-month CPI rate, which makes the PPI annual figures more useful than usual as a yearly cross-check.
CNBC reported that policymakers worry price pressure from the Iran war, higher fuel costs and President Donald Trump's tariffs is spreading more broadly. Chicago Fed President Austan Goolsbee told CNBC that inflation has run above 2% for almost six years, and that categories not driven by oil or tariffs also show stalled progress, in some cases going backwards. "Inflation is rising; it's proved far more persistent than we predicted at the beginning from the supply shocks," he said.
Why it matters over years, not days
Markets reacted calmly on the day: stock futures extended gains, while Treasury yields were mixed. For a long-term investor, the more durable question is whether inflation is a passing shock or a broad, sticky trend. A single month rarely answers that. A run of rising pipeline costs, across goods and services and outside energy, is the kind of evidence that shapes the answer.
That matters because persistent inflation tends to keep interest rates higher for longer. The Federal Reserve meets next on Dec. 8-9, and markets fully price a quarter percentage point increase, with small odds of a half-point move. Chris Zaccarelli of Northlight Asset Management said the PPI release is unlikely to change the Fed's December approach, since CPI was already too hot. The Fed remains well away from its 2% goal, CNBC noted.
Higher rates affect the value of bonds already held, the cost of borrowing for companies, and the yardstick investors use to value future earnings. Bond prices can fall when rates rise, and any investor can lose money. None of that tells anyone what to trade. It does explain why a producer price report can matter to a portfolio meant to last decades. A caveat: intermediate costs do not always pass through in full, because businesses sometimes absorb them in their margins.
Questions to ask about your own plan
A report like this is a prompt to check assumptions rather than to act on headlines.
- Does my plan assume inflation returns quickly to target, and how would it hold up if prices stay high for longer?
- How sensitive are the bonds or bond funds I own to interest rates staying higher?
- Am I reading the monthly surprise or the longer trend when I react to economic news?
Sources
- CNBC, 13 Nov 2026
AI-drafted from the official releases cited above and published automatically after checks that every number matches its source and no sentence is copied. No human edited it. It explains what the data means for long-term investors, not what to trade.